|
|
|
|
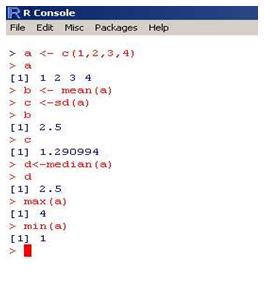
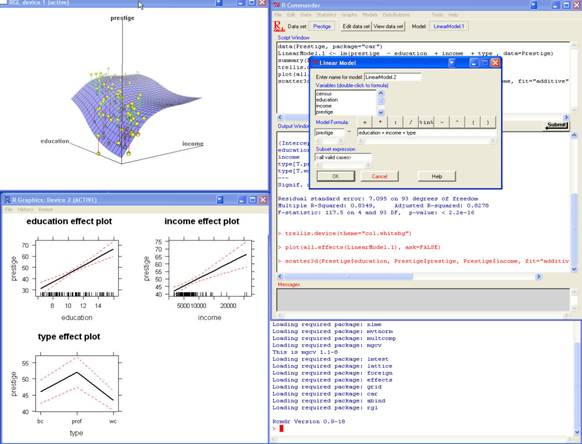
Doing Tricks with Some Cheap Numbers: Free Mathematical and Statistical Software for Frugal Number Crunchers by Bernard Gorman I teach courses in psychology and statistics. I want my students to do hands-on computation for problems that I construct either to make some truly brilliant pedagogical points or to analyze some “real-world” data. In the bad-old-days, students were tethered to mainframe university computer centers. For me, the sheer memory of these places evokes the symptoms of a post-traumatic stress disorder. Nowadays, students have several slick programs for running their statistical problems. Among these are SPSS and SAS. Unfortunately, site licenses for these programs packages are costly and while there are some flexible multiple-copy, student version, and rental pricing arrangement policies; many students still can’t afford them. Worse yet, students find ways to make many “back-ups” of the original software that their wealthier classmates purchased. Fortunately, there’s some great statistical software stuff out there that’s absolutely free. Moreover, these programs typically have more sophisticated procedures than the commercial programs. “How come?” you may ask. I’m so glad you asked! (I was going to tell you the answers anyhow!) Governments give large grants to universities and scientific research centers for statisticians to develop software. Because these projects were funded by public money, the software is in the public domain. That means that taxpayers (and even tax cheats like Ralph, my next-door-neighbor) can get these programs free. Another stream of free software flows from the “Open Source” movement. Open Source developers release their programs free-of-charge for anyone to use and modify as long as the original authors are given appropriate credit and any modifications are documented. How do Open Source developers make a living? Well, remember that the programs are free but you may want to pay for their expertise as consultants and their good works often serve as powerful advertisements for their other products and services. Basically, I’m saying that if you own a paintbrush, you’re not necessarily going to become Picasso. You might have wanted to hire Pablo, himself, to paint a mural for your kid’s room. Personally, I found that Guernica scared the hell out of my daughters, Betsy and Leanne, at bedtime. So much for digression; let me get back to my story. I’m unbelievably impressed by a statistical program package called R, available from CRAN, The Comprehensive R Archive Network (http://cran.r-project.org/) was originally developed at Bell Laboratories, as S, a statistical language. When Ma Bell divested herself to go to other ventures, S was further developed as a commercial program. S-plus. However, a very dedicated international group of statistical programmers developed the Open Source program, R. You can solve nearly any statistical problem with it and R can be extended to perform procedures that haven’t been invented yet. The R program and its documentation are free and it runs on Windows, Linux, and Mac systems. To get started with R, you must download the program from the site and install it on your system. The program comes with many standard statistical procedures, help files, and some sample data sets. The main interface, the R Console, seen below, is rather sparse. It has a command-line structure that is reminiscent of its earlier roots in systems like DOS and UNIX. As a very simple example, I’ve computed the mean, the standard deviation, the median, the maximum, and the minimum of four numbers: 1, 2, 3, and 4. Many statisticians like the clean look of the R Console. However, most novices and occasional users will prefer a more convenient graphical user interface (GUI). Fortunately, there are several of them and, like R itself, they’re free. One of the best is R Commander, written by John Fox at McMaster University at http://socserv.mcmaster.ca/jfox/Misc/Rcmdr/. This very user-friendly interface can take files from spreadsheet and database programs and will perform most of the common statistical procedures. As you can see in the figure below, which I downloaded from Fox’s site, R Commander produces some impressive graphs.
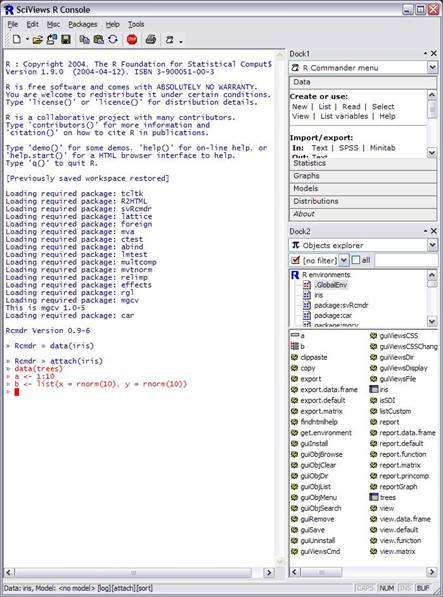
The SciViews GUI (www.sciviews.org/SciViews-R/) shown below includes the R Commander as one of its features but it also has more extensive help screens and editors as well as the ability to connect to laboratory equipment and to produce HTML output for web display.
R has numerous advantages (no pun intended) It’s free. It has a bare-bones interface for purists and experts and graphical interfaces for beginners, timid and lazy people, and the rest of us. Most importantly, it can easily perform the most common as well as the most sophisticated statistical procedures. Anyone who works or plays with numbers should have this powerful toolkit. |
|
Copyright © 1999 - 2012
PC Lifeline
|